![]() Figure 3 of
Wordinger, Mol Vis 2002;
8:241-250.
Figure 3 of
Wordinger, Mol Vis 2002;
8:241-250.
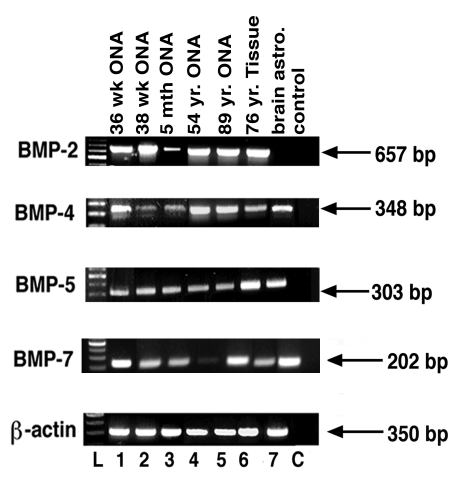
Figure 3. BMP expression in human ONH astrocytes, ONH tissues, and human brain astrocytes
Ethidium bromide-stained agarose gel of PCR products from cDNA samples generated from RT-PCR analysis of BMP expression in human ONH astrocytes (lanes 1-5), ONH tissue (lane 6), and human brain astrocytes (lane 7). L = base pair markers. C = PCR negative control lane. β-actin was used as a positive RT-PCR internal control.