![]() Figure 4 of
Lee, Mol Vis 2002;
8:235-240.
Figure 4 of
Lee, Mol Vis 2002;
8:235-240.
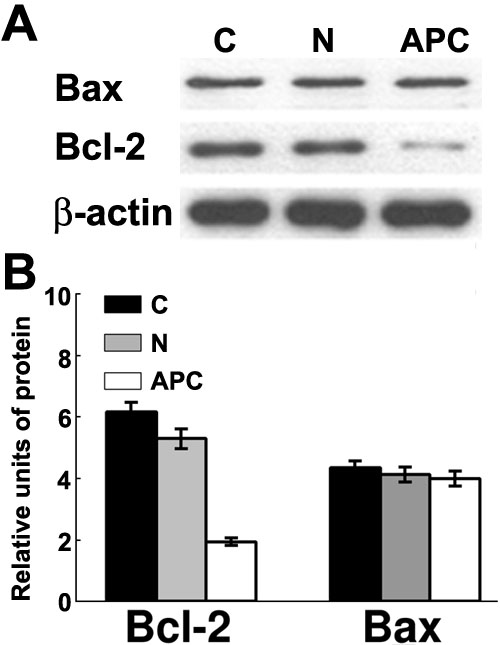
Figure 4. Detection of apoptotic and anti-apoptotic markers by western blot analysis
Cell lysates were prepared from lens epithelial cells attached to the anterior capsules. A: The levels of Bax and Bcl-2 proteins were assessed by Western blot analysis. After separating proteins by SDS-PAGE, the whole gel was immunoprobed. β-actin was used as the loading control indicator. Lane C was non-cataractous clear lenses; lane N was nuclear cataracts; lane APC was anterior polar cataracts. B: Proteins were quantified using a bioimaging analyzer (Bio-Rad Imaging System, Bio-Rad, Hercules, CA), and expressed in arbitrary units. Proteins in each lane were, control (C), nuclear cataracts (N), and anterior polar cataracts (APC). Each displayed value was normalized against the density of the respective band of β-actin. The bar graph shows the mean value of samples from 6 patients; the error bars indicate the standard deviation. There were statisitcally significant differences in Bcl-2 levels both between the non-cataractous clear lenses (C) and anterior polar cataracts (APC) and between nuclear cataracts (N) and anterior polar cataracts (p=0.002, Mann-Whitney U test).