![]() Figure 2 of
Lee, Mol Vis 2002;
8:17-25.
Figure 2 of
Lee, Mol Vis 2002;
8:17-25.
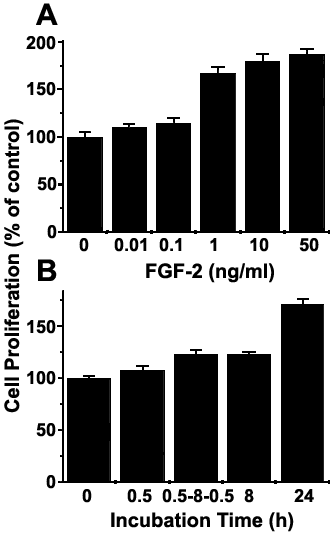
Figure 2. Effect of FGF-2 on cell proliferation
CEC (4x10³) were plated in 96 well tissue culture plates, and the 60% confluent cells were deprived of serum for 24 h. Cells were then treated with FGF-2 in concentrations ranging from 0.01 ng/ml to 50 ng/ml (A) or treated with FGF-2 (10 ng/ml) for 30 min, two 30 min exposures with an 8 h interval between (0.5-8-0.5 h), for 8 h, or for 24 h (B). At the end of the treatment with FGF-2, cell proliferation was assayed as described in the text. Experiments were done in triplicate and repeated four times; data shown are from one experiment. Error bars represent the standard error of the mean.
