![]() Figure 3 of
Golestaneh, Mol Vis 2002;
8:221-225.
Figure 3 of
Golestaneh, Mol Vis 2002;
8:221-225.
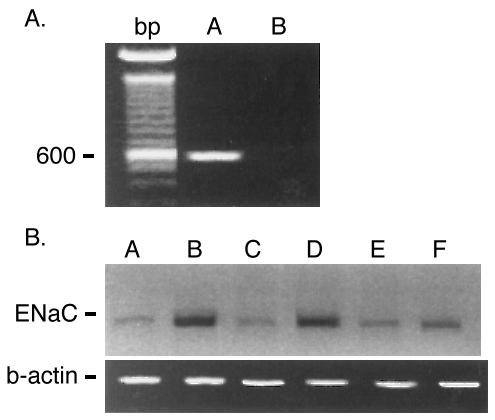
Figure 3. Epithelial sodium channels in RPE cells regulated by aldosterone
Demonstration of ENaC by RT-PCR analysis and regulation of ENaC in RPE cells by aldosterone. A: In electrophoresis, the PCR products (Lane A) were shown as predicted bands of 520 bp for the ENaC and control (Lane B). B: RPE cells were exposed to 0.1% ethanol vehicle and 10 mM aldosterone. The cells were thereafter processed for semi quantitative PCR analysis using random DNA labeling with DIG-11-dUTP, using β-actin as the control marker. The time dependent regulation of the amiloride sodium channel by aldosterone (Lanes B, D, and F) has been demonstrated at 12, 24, and 36 h and compared to the basal level of ENaC by endogenous steroids in the serum with 0.1% ethanol (Lanes A, C, and D).