![]() Figure 1 of
Golestaneh, Mol Vis 2002;
8:221-225.
Figure 1 of
Golestaneh, Mol Vis 2002;
8:221-225.
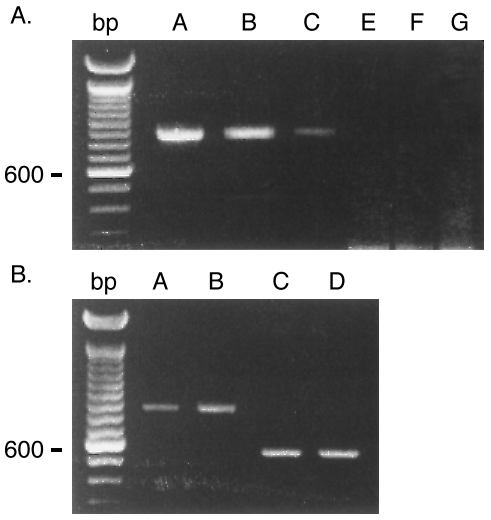
Figure 1. Mineralocorticoid receptor in retina, RPE, and ciliary body
A: Demonstration of the MR by RT-PCR analysis in whole rat retina (Lane A), in RPE cells (Lane B), in ciliary body (Lane C), and controls for retina, bovine RPE, and rat ciliary body cells (Lanes E, F, and G), respectively. B: Photoreceptor layer (Lane A) and other retinal neurons (Lane B) compared to β-actin (Lanes C and D), respectively. The electrophoresis of the PCR products was resolved as predicted bands of 834 bp in retina and 460 bp for β-actin.