![]() Figure 5 of
Wistow, Mol Vis 2002;
8:205-220.
Figure 5 of
Wistow, Mol Vis 2002;
8:205-220.
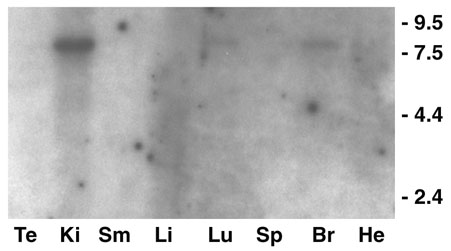
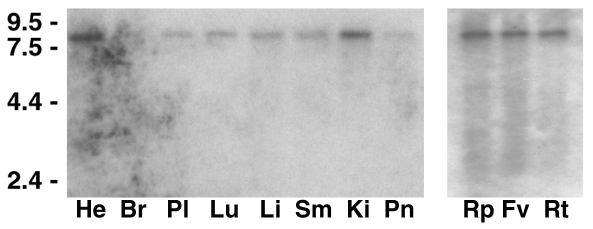
Figure 5. Expression pattern of the alpha gene transcript
A: Panel on left is a human polyA+ blot (Clontech MTN). Tissues: heart (He), brain (Br), placenta (Pl), lung (Lu), liver (Li), skeletal muscle (Sm), kidney (Ki), pancreas (Pn). Panel on right is a total RNA blot of rhesus monkey. Tissues are RPE (Rp), fovea (Fv) and peripheral retina (Rt). Probe for both blots is an antisense riboprobe derived from human alpha gene cDNA. Transcripts sizes are indicated in kb. B: Mouse MTN. Tissues: testis (Te), kidney (Ki), skeletal muscle (Sm), liver (Li), lung (Lu), spleen (Sp), brain (Br), heart (He). All blots have equal loading of either polyA+ or total RNA in each lane.
A
B