![]() Figure 1 of
Wistow, Mol Vis 2002;
8:164-170.
Figure 1 of
Wistow, Mol Vis 2002;
8:164-170.
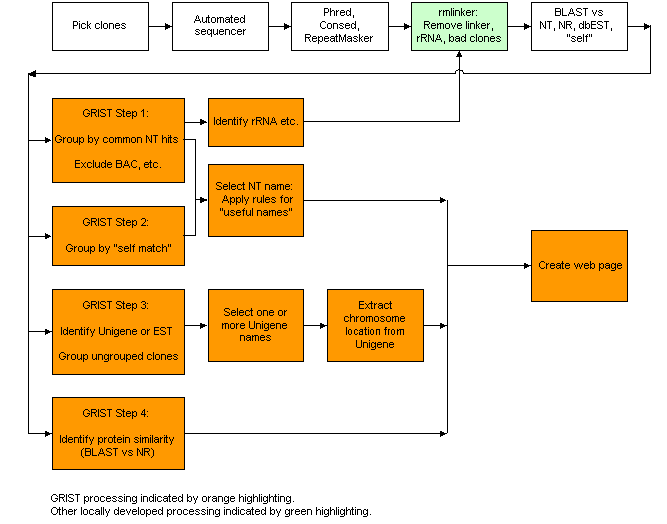
Figure 1. The NEIBank pipeline
This flow chart illustrates the path from picking cDNA clones through sequencing and analysis to display of the data in the web site. New informatics tools are shown by colored boxes. The green box indicates rmlinker, a program that removes cloning artifacts (such as linker concatamers) and non-mRNA clones that are identified by GRIST. The orange boxes indicate the major conceptual stages of the GRIST processing itself. A more detailed flow chart is available at the NEIBank web site.