![]() Figure 8 of
Kinkl, Mol Vis 2002;
8:149-160.
Figure 8 of
Kinkl, Mol Vis 2002;
8:149-160.
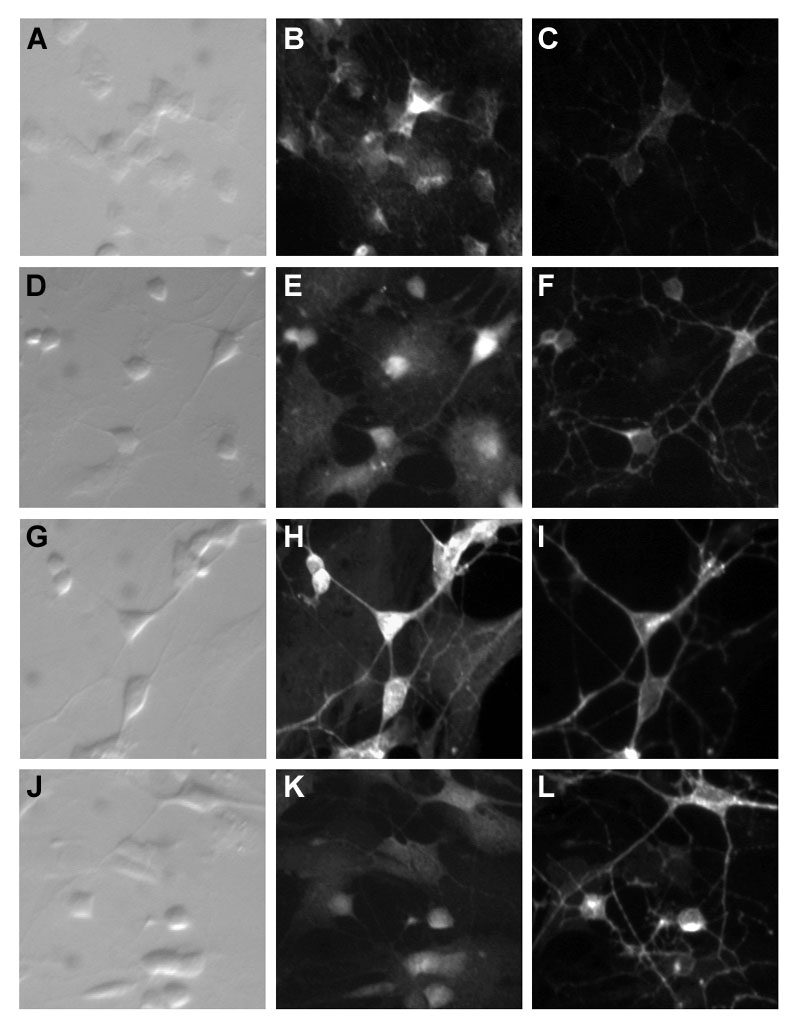
Figure 8. Generalised distribution of candidate FGF-related signaling molecules within selected inner retinal cell populations after 3 d in vitro
Panels A, D, G, J: Inner retinal cultures visualised by differential interference microscopy. Panels B, C, E, F, H, I, K, and L: Corresponding fields viewed by fluorescence microscopy. B: Field in A labeled with anti-SOS1. C: Field in A labeled with 115A10 showing faint immunopositive bipolar cells. E: Field in D labeled with anti-SOS2. F: Field in D labeled with HPC1 showing extensive network of amacrine cells. H: Field in G labeled with anti-ERK1/2. I: Field in G labeled with HPC1. K: Field in J labeled with anti-SH-PTP2. L: Field in J labeled with HPC1. Magnification x1000.