![]() Figure 6 of
Zhou, Mol Vis 2002;
8:143-148.
Figure 6 of
Zhou, Mol Vis 2002;
8:143-148.
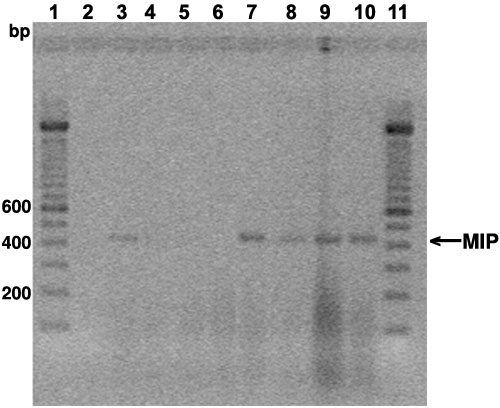
Figure 6. MIP gene expression in mouse embryos from age E10 to E13
Lane 1: 100 bp molecular weight marker. Lane 2: negative control for MIP primer. Lane 3: positive tissue control (adult lens total RNA) for MIP primer. Lane 4: mRNA from E10.0 embryonic bodies. Lane 5: mRNA from E10.5 embryonic bodies. Lane 6: mRNA from E11.0 embryonic heads. Lane 7: mRNA from E11.5 embryonic heads. Lane 8: mRNA from E12.0 embryonic heads. Lane 9: mRNA from E12.5 embryonic heads. Lane 10: mRNA from E13.0 embryonic heads. Lane 11: 100 bp molecular weight marker.