![]() Figure 5 of
Yu, Mol Vis 2002;
8:130-137.
Figure 5 of
Yu, Mol Vis 2002;
8:130-137.
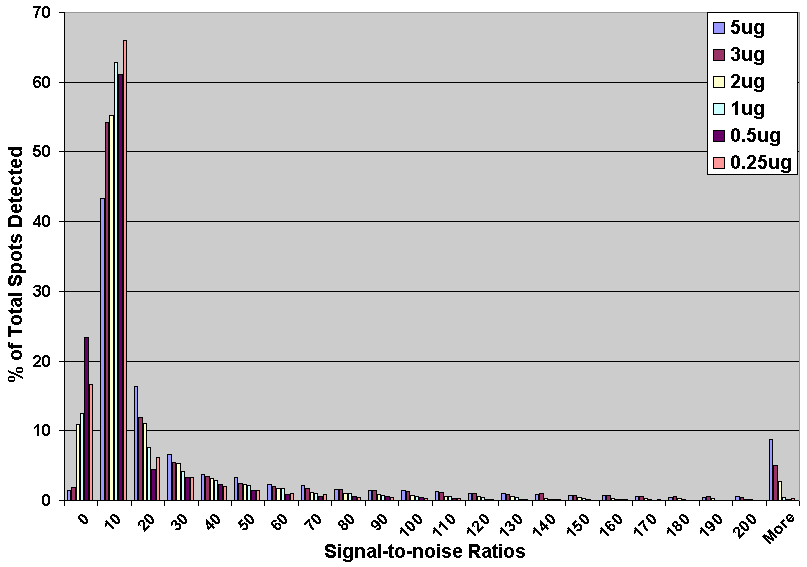
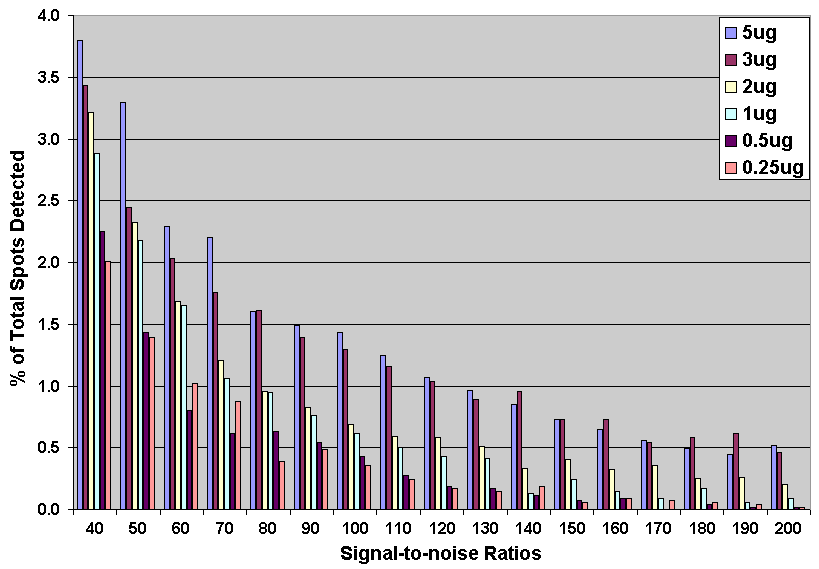
Figure 5. Signal-to-noise ratio (SNR) for serial hybridization
Histogram of SNR were constructed for all spots detected in a series of hybridizations performed with different amounts of starting RNA: 5, 3, 2, 1, 0.5, and 0.25 mg. A: With higher amounts of RNA, fewer spots have SNR lower than 20. B: Targets derived from 3-5 mg of total RNA resulted in more spots with higher SNR.
A

B
