![]() Figure 4 of
Yu, Mol Vis 2002;
8:130-137.
Figure 4 of
Yu, Mol Vis 2002;
8:130-137.
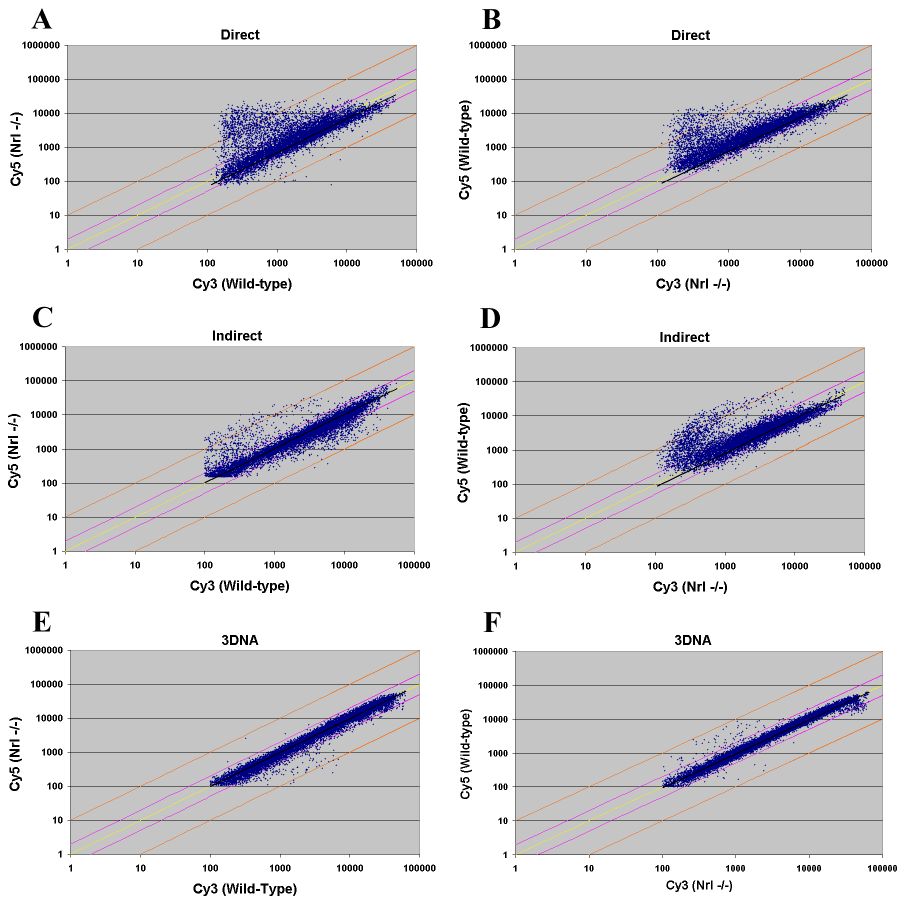
Figure 4. Scatter plots of two target hybridization
Two different targets, labeled using RNA either from Nrl+/+ (Wild-type) or Nrl-/- mice retina, were hybridized to M6000 slides, which contains over 13000 spots. The graphs on the left represent data generated by labeling RNA from Nrl+/+ mouse retina by Cy3 and RNA from Nrl-/- mice retina by Cy5, while the graphs on the right was created by dye flip-over hybridizations. Similar scatter plots were observed between A and B (direct), and C and D (aminoallyl indirect), although a reverse pattern was expected for dye flip-over experiments (as shown in E and F with Genisphere 3DNA method). Furthermore, the Genisphere 3DNA method results in a higher R2 value of 0.92 in both E and F, compared to 0.4 in A, 0.6 in B, 0.8 in C, and 0.6 in D.
