![]() Figure 3 of
Yu, Mol Vis 2002;
8:130-137.
Figure 3 of
Yu, Mol Vis 2002;
8:130-137.
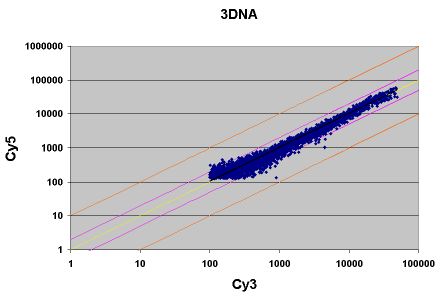
Figure 3. Scatter plot of self-against-self hybridization
Genisphere 3DNA labeled targets were hybridized to M2500 slides, containing over 5000 spots. The scatter plot indicates a majority of spots lie within 2-fold lines. Linear regression of data shows an R2 value of 0.96.
