![]() Figure 2 of
Yu, Mol Vis 2002;
8:130-137.
Figure 2 of
Yu, Mol Vis 2002;
8:130-137.
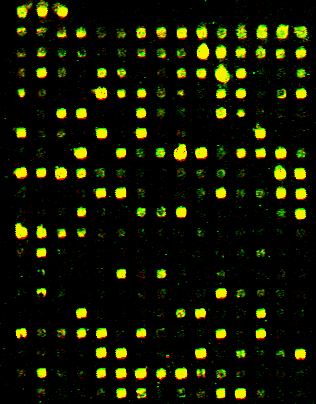
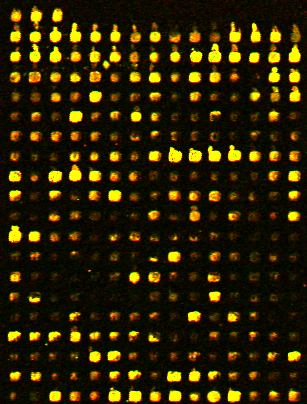
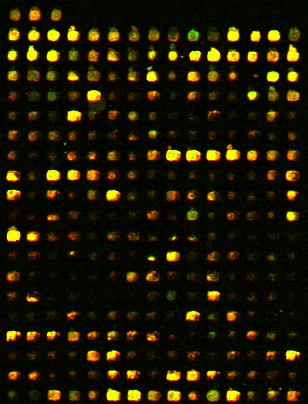
Figure 2. False color overlaid images
Cy3 (green) and Cy5 (red) images of a sub-grid of M2500 slides after self-against-self hybridization were overlaid to show relative expression of each spots in both channels. False color overlaid images of Cy3 (green) and Cy5 (red) channels of a sub-grid from self-against-self hybridization using M2500 slides. In both A (direct labeling) and B (aminoallyl indirect labeling), higher intensity in Cy5 was detected for spots that have low hybridization. Genisphere 3DNA indirect labeling (C) produced primarily yellow overlaid images for abundant genes and low signal in both channels for low hybridization spots, indicating equal incorporation of dyes.
A
B
C