![]() Figure 6 of
Ko, Mol Vis 2002;
8:1-9.
Figure 6 of
Ko, Mol Vis 2002;
8:1-9.
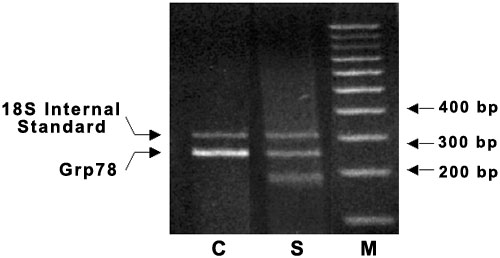
Figure 6. RQ RT-PCR analysis of Grp78/Bip mRNA expression levels
mRNA preparation from CEC and CSF and subsequent PCR was performed as described in the text. The PCR products were separated on 2% agarose and stained with ethidium bromide. Abbreviations: C, CEC; S, CSF; M, 100 bp ladder. The data represent two independent experiments.