![]() Figure 2 of
Wagner, Mol Vis 2001;
7:57-62.
Figure 2 of
Wagner, Mol Vis 2001;
7:57-62.
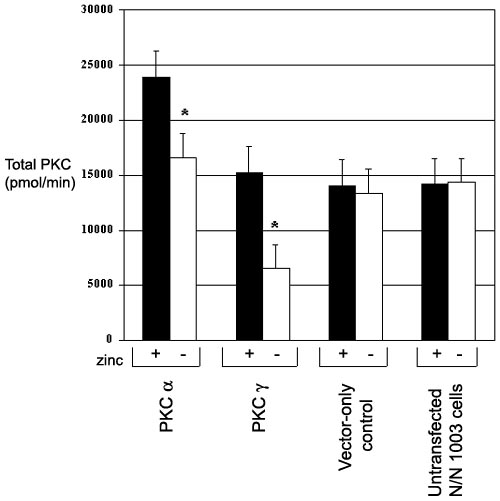
Figure 2. Effect of the overexpression of PKCa and PKCg upon PKC activity
Results using the Student's t-test for independent samples (n=5) and p<0.05 indicate that the total PKC activity in cells overexpressing PKCa and PKCg was significantly increased (1.5 fold for PKCa and 2.3 fold for PKCg) compared to untransfected with or without zinc acetate and the vector-only control. Results are expressed as total PKC activity in pmol of substrate phosphorylated/min ± standard error of the mean.