![]() Figure 8 of
Yu, Mol Vis 2001;
7:48-56.
Figure 8 of
Yu, Mol Vis 2001;
7:48-56.
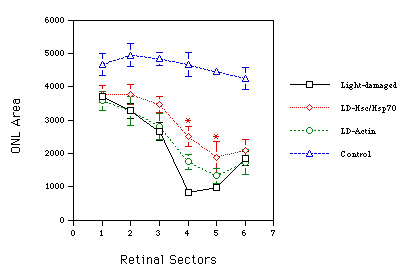
Figure 8. Inhibition of light-induced photoreceptor cell death in the eyes injected with Hsc/Hsp70 immediately after light exposure
The graph illustrates the area (m2±SEM) occupied by the ONL at each of six sectors from the inferior (1-3) and superior (4-6) retinas of four treatment groups, those maintained under normal illumination (blue, control), those which received intravitreal Hsc/Hsp70 after light damage (LD-Hsc/Hsp70, red), those which received intravitreal actin after light damage (LD-Actin, green), and those which were untreated after light damage (Light-damaged, black). Statistical comparisons (ANOVA) of the Hsc/Hsp70 and actin treatment groups with the untreated light-damaged group documented that only the Hsc/Hsp70 group had significantly more photoreceptors, with the greatest effect being in the superior retinal sectors which are most vulnerable to light damage (asterisks, p<0.05, sectors 4 and 5). n=6 per group.