![]() Figure 6 of
Yu, Mol Vis 2001;
7:48-56.
Figure 6 of
Yu, Mol Vis 2001;
7:48-56.
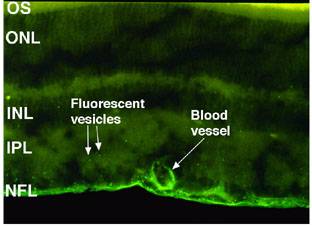
Figure 6. Epifluorescence micrograph of one region of the retina from an eye at 6 h after an intravitreal injection of fl-actin
This image taken from the mid-retina shows that the general pattern of uptake of fl-actin was similar to that of fl-Hsc/Hsp70 at six h, including the presence of vesicular accumulations of the protein and the greater uptake into perivascular or vascular cells. The lower intensity of fl-actin fluorescence compared to fl-Hsc/Hsp70 cannot be ascribed to uptake differences, as the specific activity of fluorescein labeling of the two proteins may not have been equivalent. Most of the IS and OS layers were not included in the image because the lower intensity of fl-actin fluorescence in these retinas made it difficult to distinguish the fluorescence there from background autofluorescence. 50x magnification. n=11.