![]() Figure 2 of
Yu, Mol Vis 2001;
7:48-56.
Figure 2 of
Yu, Mol Vis 2001;
7:48-56.
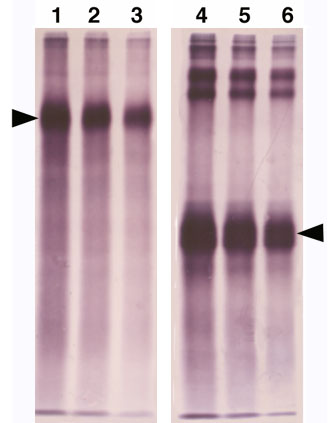
Figure 2. Western blot analysis of fluorescein-labeled Hsc/Hsp70 and actin
Lanes 1-3 are samples of 100, 50, and 25 ng fl-Hsc/Hsp70, respectively. The left arrowhead indicates intact fl-Hsc/Hsp70. This blot did not resolve as separate bands the Hsc70 and Hsp70 present in this preparation because of the relatively small difference in molecular weights. The relative purity of this preparation was confirmed by the fact that even in the lane with 100 ng fl-Hsc/Hsp70, only traces of other proteins of higher or lower molecular weights were detected. Lanes 4-6 are samples 100, 50, and 25 ng fl-actin. This preparation did contain significant amounts of some higher molecular weight proteins, but these were not considered to be of concern, since it was used as a negative control.