![]() Figure 1 of
Pearce-Kelling, Mol Vis 2001;
7:42-47.
Figure 1 of
Pearce-Kelling, Mol Vis 2001;
7:42-47.
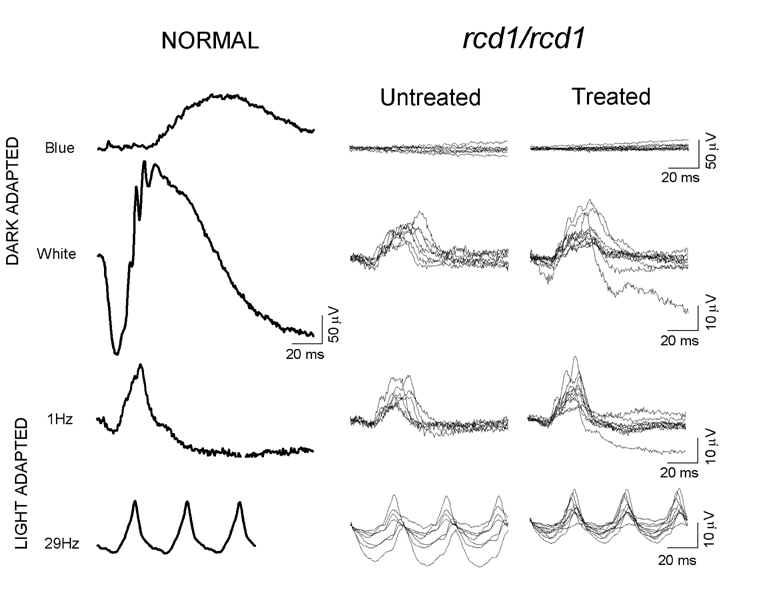
Figure 1. Rod, mixed cone-rod, and cone electroretinograms
Rod, mixed cone-rod, and cone electroretinograms in a representative normal dog and the untreated and D-cis-diltiazem-treated rcd1-affected dogs in this study. All ERG responses of rcd1 dogs are shown by overlaying the waveforms from each group. Stimulus onset is at trace onset. Calibrations for amplitude and timing are below and to the right of the responses.
