![]() Figure 2 of
Jomary, Mol Vis 2001;
7:36-41.
Figure 2 of
Jomary, Mol Vis 2001;
7:36-41.
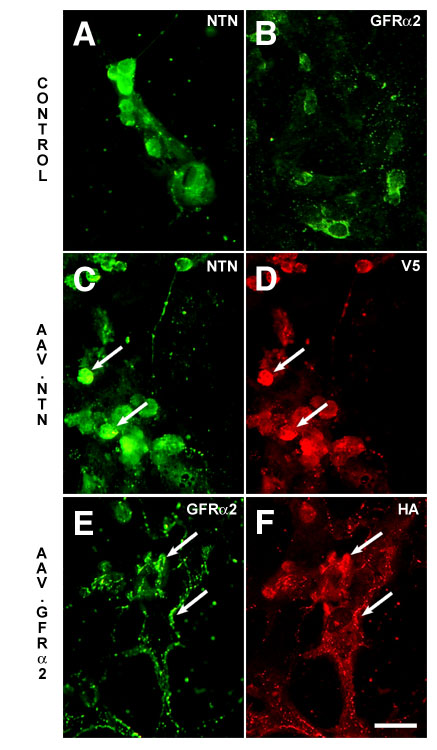
Figure 2. Immunofluorescence analysis of retinal cell cultures
Immunofluorescence analysis of retinal cell cultures non-infected (panels A and B) or infected with AAV.NTN (panels C and D), or infected with AAV.GFRa-2 (panels E and F). A polyclonal goat anti-human NTN antibody (panel A) and a polyclonal goat anti-human GFRa-2 antibody (panel B) were used to detect endogenous expression in control non-infected cells. In AAV.NTN infected cells (panels C and D), total NTN gene expression (endogenous and transgene) was detected using a polyclonal goat anti-human NTN antibody (panel C), in conjunction with a monoclonal anti-V5 antibody detecting NTN transgene expression (panel D). In AAV.GFRa-2 infected cells (panels E and F), total GFRa-2 expression (endogenous and transgene) was detected using a polyclonal goat anti-human GFRa-2 antibody (panel E) in combination with a monoclonal anti-HA antibody detecting the transgene expression (panel F). Arrows show co-localized expression of transgenes and either NTN (panels C and D), or GFRa-2 (panels E and F) proteins. Bar, 100 mm.