![]() Figure 5 of
Jablonski, Mol Vis 2001;
7:27-35.
Figure 5 of
Jablonski, Mol Vis 2001;
7:27-35.
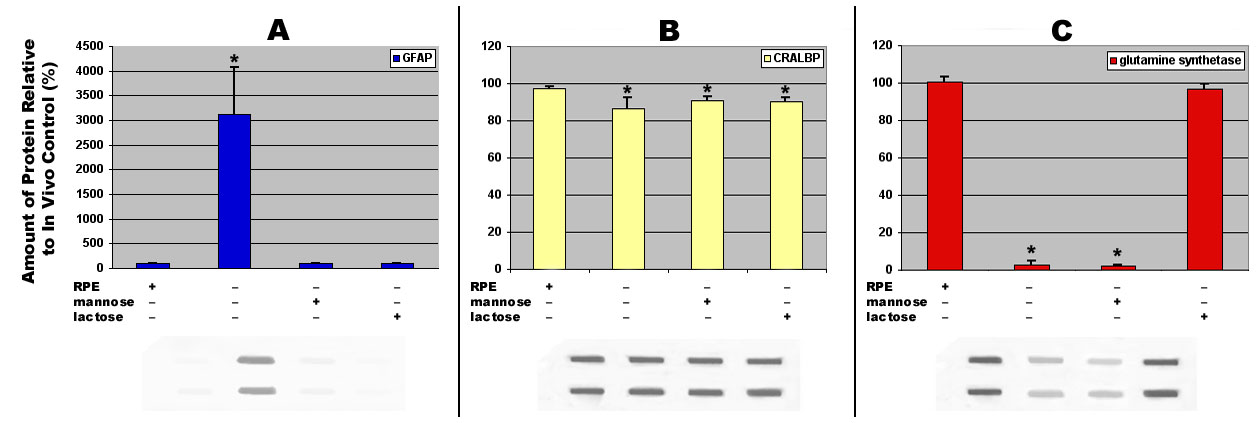
Figure 5. Relative steady-state levels of Müller cell proteins in degenerating and lactose-protected retinas
Values in the bar graphs are normalized to the amounts of each protein measured in embryonic eyes allowed to develop in vivo to stage 42. Asterisks at the top of the bars in the graphs indicate statistically significant differences vs. in vitro control. Below each graph is a representative immunoblot for each Müller cell marker from which the data were derived. A: GFAP expression levels. In the presence of the RPE, Müller cell expression of GFAP was negligible. RPE removal induced a significant upregulation of this stress marker (3,115.3±960.4%, p <0.0001 vs. control), while both mannose and lactose suppressed GFAP upregulation (102.9±7.4%, and 99.7±3.0%, respectively). B: CRALBP expression levels. In the absence of the RPE, CRALBP was slightly yet significantly reduced compared to control retinas (86.3(5.9%; p=0.0037). Neither mannose nor lactose stimulated an upregulation of this protein (91.0 pom 2.1%; p=0.0457) and 87.7±2.5%, p=0.0078, respectively). C: Glutamine synthetase expression levels. Steady-state glutamine synthetase levels were reduced to negligible levels in the absence of the RPE, and mannose was not able to prevent this decrease (on average, less than 3% of control retinas, p<0.0001 for both comparisons). In contrast, the addition of lactose was associated with an expression of glutamine synthetase in Müller cells at near normal levels (97.0±2.6%, p=0.0910 vs.control and p<0.0001 vs. the two other experimental conditions). Representative immunoblots illustrating the differences in steady-state protein expression levels by Müller cells are presented beneath their corresponding experimental conditions.