![]() Figure 6 of
Rohrer, Mol Vis 2001;
7:288-296.
Figure 6 of
Rohrer, Mol Vis 2001;
7:288-296.
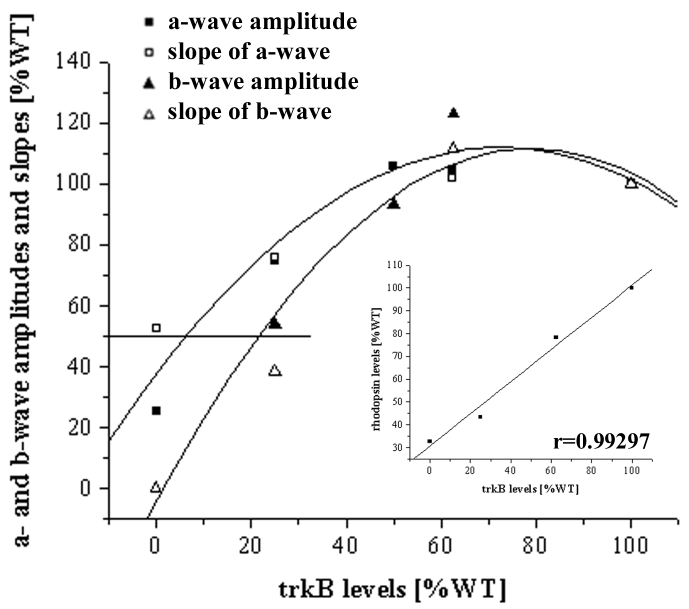
Figure 6. Correlation analysis of electroretinogram components with respect to percentage trkB and rhodopsin content
A- and b-wave amplitudes and slopes were plotted against trkB concentration. A-wave amplitude and kinetics (indicated by closed and open squares) could be fitted by a single polynomial, indicating that the two components develop in conjunction. The same is true for b-wave components (indicated by closed and open triangles). A-wave components require 15% less trkB to reach 50% wild type (WT) levels in comparison to b-wave components. As trkB levels and rhodopsin content were determined to be linearly correlated as shown by the regression analysis in the insert (r=0.99297), these findings argue that the biochemical age of the mutant retinas is shifted towards less rhodopsin or a younger actual age.
