![]() Figure 4 of
Rohrer, Mol Vis 2001;
7:288-296.
Figure 4 of
Rohrer, Mol Vis 2001;
7:288-296.
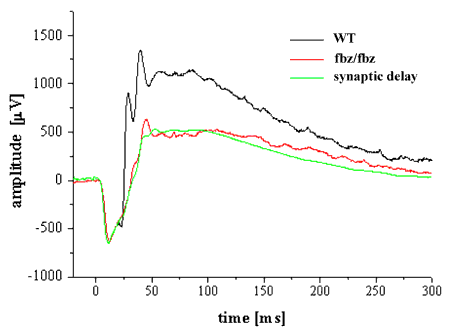
Figure 4. Electroretinograms of wild type (WT) and trkBfbz/fbz animals and model introducing synaptic delay and reduced gain
The WT and trkBfbz/fbz traces (black and red traces) demonstrate the reduced amplitude and slower rate of onset in the trkBfbz/fbz b-wave at saturating a-wave intensity. The b-wave of the mutant trace was recreated by using the b-wave of the WT trace as a template. The presynaptic delay model, which assumes variable delays in the turn off of synaptic transmitter release from rods in response to light (green trace), demonstrates that the mutant b-wave can be recreated by introducing a total synaptic delay of 16 msec as well as a scaling factor of 54%, at the expense of the oscillatory potentials (see text for more details).
