![]() Figure 3 of
Rohrer, Mol Vis 2001;
7:288-296.
Figure 3 of
Rohrer, Mol Vis 2001;
7:288-296.
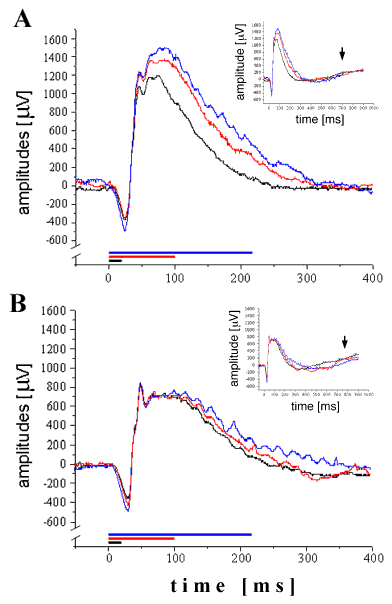
Figure 3. Analysis of b-wave kinetics
Electroretinogram responses of wild type (WT) and trkB hypomorphic (trkBfbz/fbz) mice were analyzed in response to flashes of constant photon flux (2.37x10⁹ photons /mm2) and increasing length. With increasing stimulus length, the a-wave kinetics get faster, without affecting the onset of the b-wave. However, increasing stimulus length increases the duration of the b-wave and thus shifts the peak of the b-wave to the right and prolongs the decay of the b-wave, without affecting the slow c-wave (inset arrows). These b-wave features are more pronounced in the trkBfbz/fbz animals (B) then in the WT controls (A). Note that even the longest stimulus (220 ms) did not elicit an OFF response (see insets in A and B). Flash durations depicted here are 20, 100, and 220 ms. For statistics, refer to text.
