![]() Figure 1 of
Rohrer, Mol Vis 2001;
7:288-296.
Figure 1 of
Rohrer, Mol Vis 2001;
7:288-296.
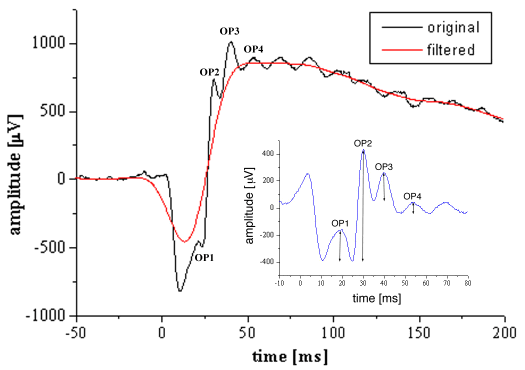
Figure 1. Analysis of oscillatory potentials
Oscillatory potentials (OPs) were determined from scotopic electroretinographic responses at maximum light intensity (3.85 x 10¹¹ photons/mm2). Original traces (black trace) were low pass filtered at 16.5 Hz (red trace) and subtracted from the original ERG wave to obtain the oscillatory potentials (see inset). This method, which was developed for the analysis of electroretinographic responses of cones, whose a-wave can be neglected, however, consistently overestimates the amplitudes of OP1 and OP2.
