![]() Figure 4 of
Yin, Mol Vis 2001;
7:271-276.
Figure 4 of
Yin, Mol Vis 2001;
7:271-276.
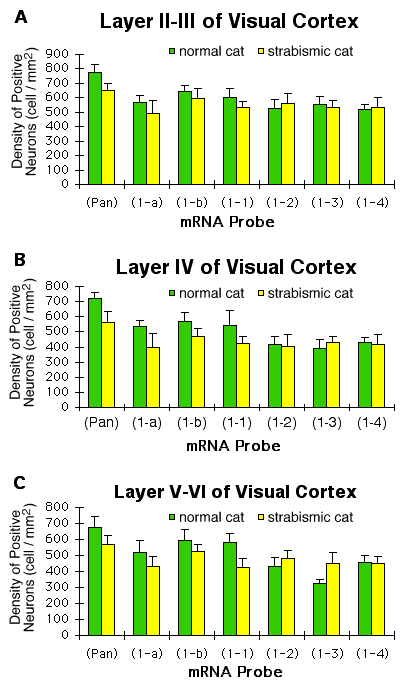
Figure 4. Laminar distribution of density of positively labelled cells
Comparison of the expression of mRNA NMDAR1 isoforms in layer II-III (A), layer IV (B) and layer V-VI (C) of the striate cortex of normal and strabismic cats. The density of expression of positively staining neurons (cell/mm2) of each of the isoforms varied between normal and strabismic cat with decreased numbers of pan probe, 1-a, 1-b and 1-1 isoforms significantly in all of layers and notably increased expression of 1-3 in layer V-VI.
