![]() Figure 3 of
Yin, Mol Vis 2001;
7:271-276.
Figure 3 of
Yin, Mol Vis 2001;
7:271-276.
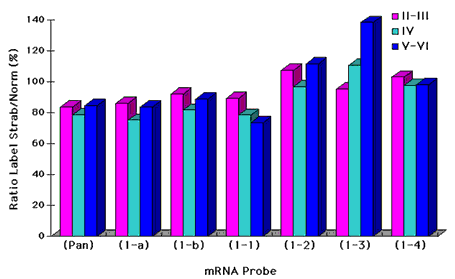
Figure 3. Strab/Norm percentage labelling for isoforms across layers
Comparison of the ratios of the number of positively stained neurons of each isoform in each of the three layers divisions (II-III, IV, and V-VI) in strabismic and normal cats (expressed as a normalized percentage). Most noticeable is the increase of NMDAR1-3 isoform in the strabismic cortex, especially in layers V-VI.
