![]() Figure 3 of
Saleh, Mol Vis 2001;
7:240-246.
Figure 3 of
Saleh, Mol Vis 2001;
7:240-246.
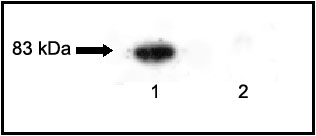
Figure 3. Western analysis of PKC-g and PKC-a
Western blot analysis of PKC-g and PKC-a was carried out in the cortical fiber cells. Cortical fiber cells were isolated, lysed and homogenized, then they were analyzed by SDS-PAGE and western blot. The nitrocellulose membranes which contained the transferred proteins were probed with anti-PKC-g at 1:1000 (lane 1) or anti-PKC-a at 1:1000 (lane 2). Protein load per lane is 100 mg protein/lane. Visualization is with enhanced chemiluminescence (ECL).