![]() Figure 2 of
Shim, Mol Vis 2001;
7:216-221.
Figure 2 of
Shim, Mol Vis 2001;
7:216-221.
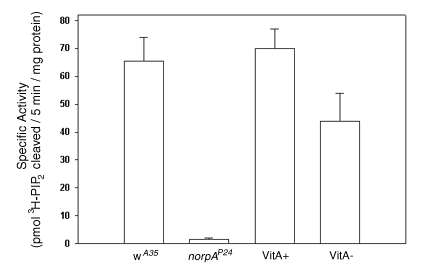
Figure 2. PLC activity analysis
PLC activity analysis comparing white-eyed (wA35) controls with norpAP24 mutants. Vitamin A deprivation decreases PLC activity relative to vitamin A replete controls.
