![]() Figure 3 of
Zhu, Mol Vis 2001;
7:210-215.
Figure 3 of
Zhu, Mol Vis 2001;
7:210-215.
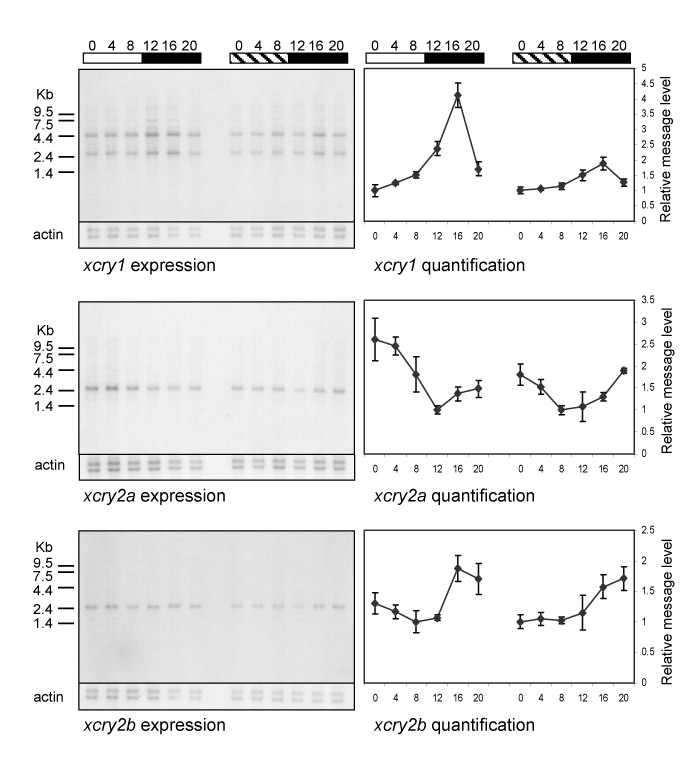
Figure 3. Temporal analysis of xcry expression in retina
Total RNA was isolated from Xenopus retina collected at 4-h intervals throughout the day from eyecups cultured in either 12L/12D (light/dark) cycles or constant darkness. Each lane contains 2 mg RNA. The ZT time of each sample is shown above. (White bars-day; dark bar-night; hatched bars-subjective day.) Matching actin results are shown below each blot. On the right, quantifications of the Northern results are shown. Each sample represents the average of three independent experiments. Error bars indicate the SEM.