![]() Figure 6 of
Schlamp, Mol Vis 2001;
7:192-201.
Figure 6 of
Schlamp, Mol Vis 2001;
7:192-201.
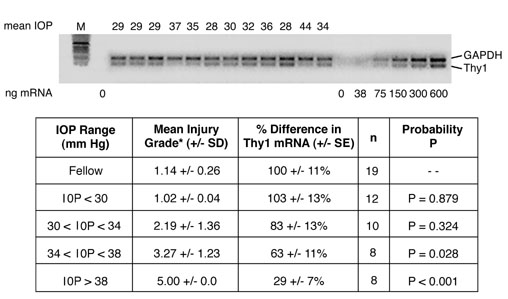
Figure 6. Quantification of Thy1 mRNA in hypertensive eyes
RT-PCR results on Thy1 mRNA levels in rat eyes with experimental glaucoma. The top panel shows a typical ethidium-bromide agarose gel (a negative image is shown) indicating the level of GAPDH message relative to Thy1 message in whole retina total RNA. The mean IOP (in mm Hg) of each eye shown is indicated above each lane. A calibration curve of increasing input RNA (in ng below relevant lanes) is on the right side of the gel. Best fit lines from a calibration curve run with every gel, were used to calculate the relative amounts of mRNA in the experimental retinas. Below the gel is a table summarizing all the quantitative data for this study. Eyes were grouped according to the range of mean IOP they sustained during the 35 day period of this study. Injury grades were scored for each eye from histological sections of their optic nerves. All data is expressed as mean percentage ± SEM of the mean value obtained for 19 uninjected, fellow eye retinas from rats housed in constant lighting conditions. A decrease in Thy1 level was detected in eyes with a minimum mean IOP of 30 mm Hg and found to be significant in all eyes that exhibited a mean IOP of 34 mm Hg or greater (Student's t-test).
Data was not available from all the eyes to calculate the mean optic nerve injury grade. The calculation was based on 12 of 19 eyes (fellow group), 6 of 12 eyes (IOP<30 group), 8 of 10 eyes (30<IOP<34 group), 8 of 8 eyes (34<IOP<38 group), and 8 of 8 eyes (IOP>38 group).