![]() Figure 4 of
Schlamp, Mol Vis 2001;
7:192-201.
Figure 4 of
Schlamp, Mol Vis 2001;
7:192-201.
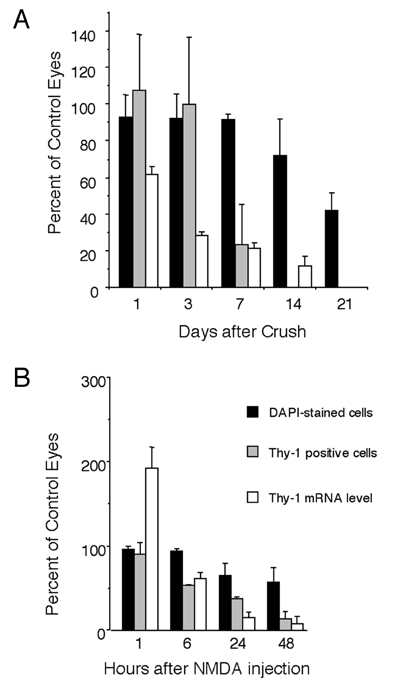
Figure 4. Quantitative analysis of Thy1 mRNA levels, Thy1 expressing cells, and total cells after acute damage
Quantitative analysis of total cell counts, Thy1 positive cells, and Thy1 mRNA abundance in retinas after optic nerve crush and NMDA-injection. All values are represented as the mean percentage of corresponding control eyes, (± SD), where the controls have been assigned a value of 100%. A: Although data from RPA experiments are sensitive enough to detect a loss of Thy1 message in the experimental eyes after optic nerve crush, the number of cells in the ganglion cell layer, and the number of Thy1 expressing cells remains constant up to 3 days after crush. By 7 days, both the mRNA levels and the number of expressing cells have dramatically decreased, even though total cell counts are not apparently different from control retinas. A detectable loss of cells is first detected by 14 days after damage, when very little Thy1 mRNA is present by RPA analysis. By 21 days after crush, no Thy1 mRNA is present by any method of detection and the retinas exhibit greater than 50% cell loss in the ganglion cell layer. B: After NMDA injection, RPA analysis indicates an increase in Thy1 mRNA abundance 1 h after injection, although the number of Thy1 positive cells remains constant. By 6 h, both the abundance of message and the number of expressing cells has begun to decrease relative to control eyes. No change is observed in the total number of cells in the ganglion cell layer at this time point. By 24 h after injection, the number of total cells present is declining, but is still exceeded by the decrease in Thy1 expressing cells, a trend that is also evident by 48 h after injection.
