![]() Figure 3 of
Schlamp, Mol Vis 2001;
7:192-201.
Figure 3 of
Schlamp, Mol Vis 2001;
7:192-201.
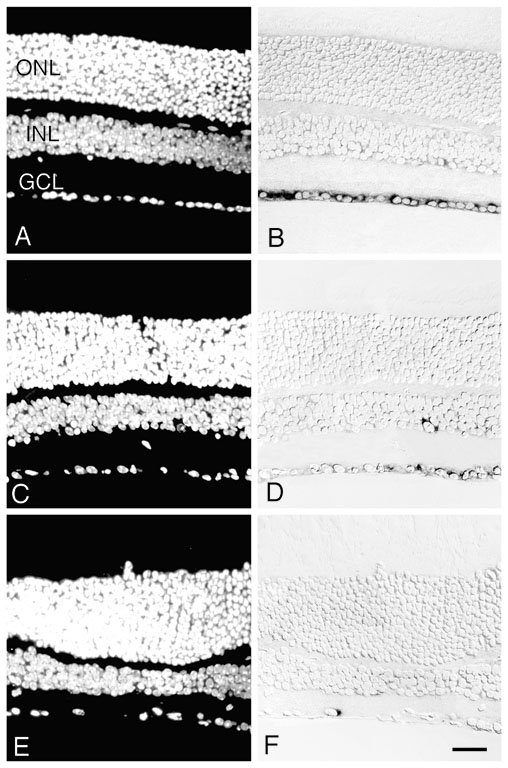
Figure 3. Localization of Thy1 expression after NMDA injection
In situ hybridization showing the loss of Thy1 mRNA in ganglion cells after intravitreal injection of 160 nmoles of NMDA. DAPI-stained and Nomarski images of the same sections of central retina are shown in the left and right panels, respectively. The sections shown are of 1 h control retina (A, B) and 6 h (C, D), and 24 h (E, F) after injection. The number of Thy1 positive cells has decreased by 6 h after injection and very few positive cells are detected in the ganglion cell layer (GCL) by 24 h. A single Thy1 positive cell is present in the inner nuclear layer (INL) of the retina in (D). This likely represents a misplaced ganglion cell and is not unique to the treatment with NMDA. ONL, outer nuclear layer. Scale bar, 20 mm.