![]() Figure 3 of
Sulik, Mol Vis 2001;
7:184-191.
Figure 3 of
Sulik, Mol Vis 2001;
7:184-191.
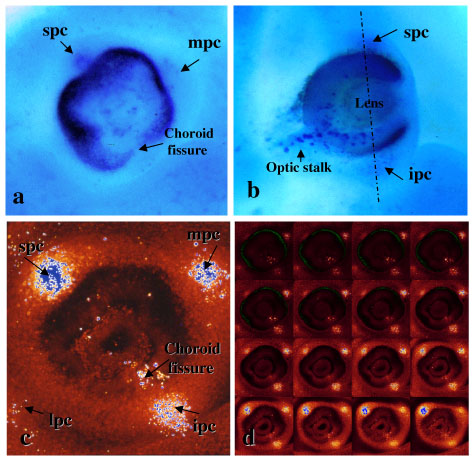
Figure 3. Apoptosis on gestational day 12
A: A whole specimen and B one sectioned through the eye illustrate NBS uptake in the peripheral condensations and optic stalk. C: A stack of confocal images are displayed as a maximum projection which appears as being superimposed. This and individual pseudocolored confocal sections D reveal the three dimensional pattern and intensity of LysoTracker Red localization. The highest fluorescence intensity is blue followed by yellow, then red. In order to observe the apoptotic regions (blue/yellow), the image intensities were saturated. In D there is an attenuation of the signal as the bottom rows near the surface are brighter than the top rows which are located in the interior of the eye. From deep (top or first row) to superficial (bottom or last row), the intensity of staining in the spc notably increases. That in the lpc increases through the levels shown in the top row and then disappears by levels shown in the third row. Relative to the other peripheral condensations, the intensity of staining in the spc is greatest. There is also intense staining in the cells of the choroid fissure.