![]() Figure 7 of
Fu, Mol Vis 2001;
7:178-183.
Figure 7 of
Fu, Mol Vis 2001;
7:178-183.
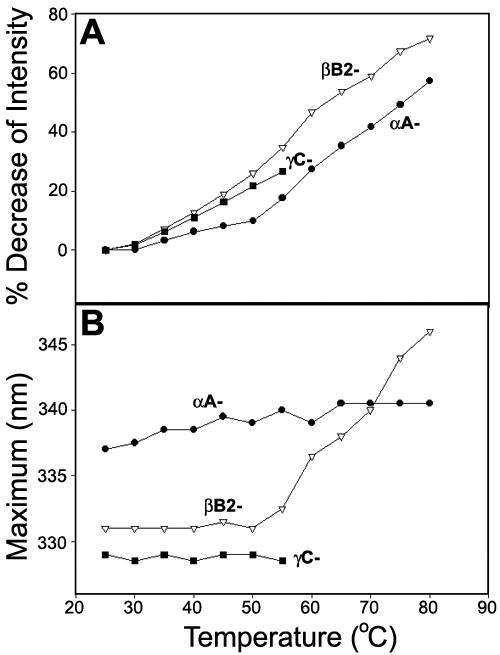
Figure 7. Thermal unfolding curves
Thermal unfolding curves were obtained for bB2- and gC-crystallin probed by Trp fluorescence emission intensity (A) and emission maximum wavelength (B). The measurements were performed at 5° intervals, and equilibrium time was 10 min. The data represented an average of two independent experiments. aA-crystallin was included for comparison.