![]() Figure 5 of
Fu, Mol Vis 2001;
7:178-183.
Figure 5 of
Fu, Mol Vis 2001;
7:178-183.
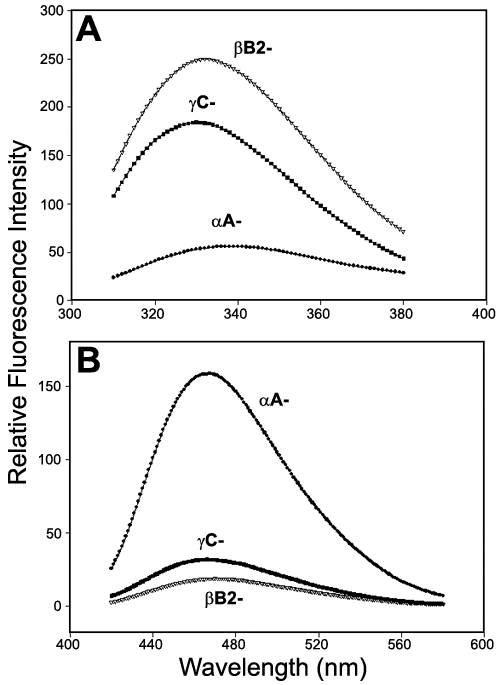
Figure 5. Trp and Bis-ANS fluorescence spectra
The figure shows Trp (A) and Bis-ANS (B) fluorescence spectra of bB2- and gC-crystallin. Protein concentrations are 0.1 mg/ml in 50 mM phosphate buffer, pH 7.4. Bis-ANS concentration is 6 mM. aA-Crystallin was included for comparison.
