![]() Figure 4 of
Fu, Mol Vis 2001;
7:178-183.
Figure 4 of
Fu, Mol Vis 2001;
7:178-183.
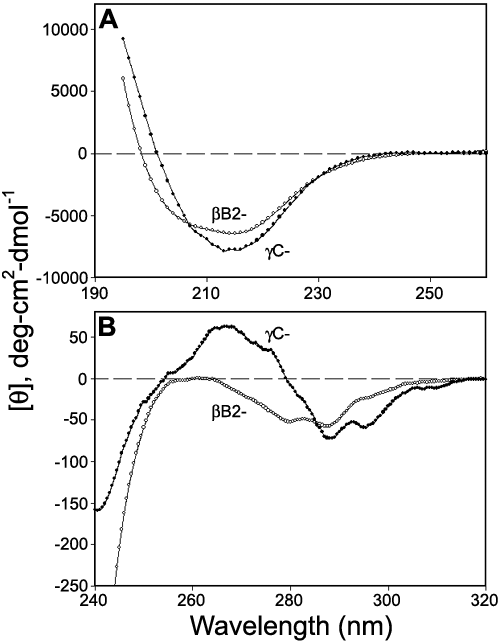
Figure 4. Far-UV and near-UV CD spectra
Far-UV (A) and near-UV (B) CD spectra for bB2- and gC-crystallin. Protein concentrations are 0.1-0.5 mg/ml in 50 mM phosphate buffer, pH 7.4. Cell-path lengths are 10 mm and 1 mm, respectively, in the far- and near-UV CD measurements.
