![]() Figure 6 of
Santhoshkumar, Mol Vis 2001;
7:172-177.
Figure 6 of
Santhoshkumar, Mol Vis 2001;
7:172-177.
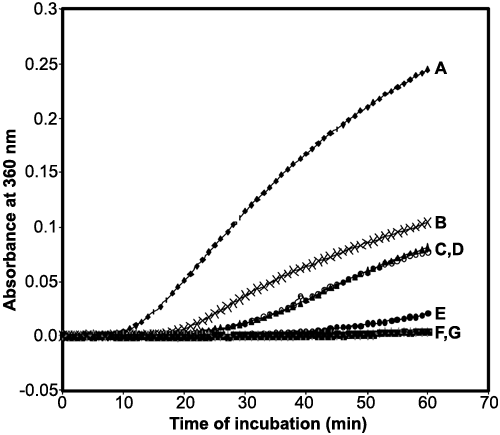
Figure 6. Thermal aggregation of CS in the presence of chaperones
Thermal aggregation of citrate synthase (CS) in the presence of chaperones at 43 °C was carried out. Curve A shows CS alone (75 mg); curve B shows CS + mini-aA-crystallin (25 mg); curve C shows CS + aA-crystallin (25 mg); curve D shows CS + aB-crystallin (25 mg); curve E shows CS + mini-aA-crystallin (50 mg); curve F shows CS + aA-crystallin (50 mg); and curve G shows CS + aB-crystallin (50 mg).
