![]() Figure 2 of
Lewis, Mol Vis 2001;
7:164-171.
Figure 2 of
Lewis, Mol Vis 2001;
7:164-171.
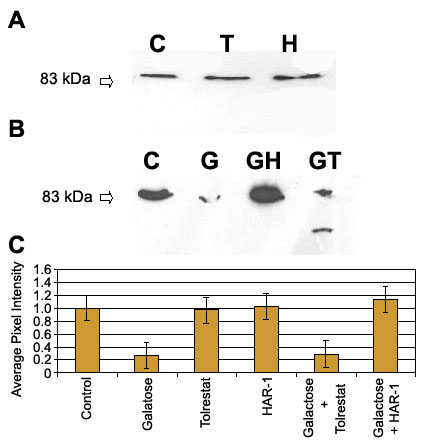
Figure 2. Analysis of PKCg content in rat lens
Bands at 83 kDa indicate the PKCg band. A: Control diet (C) versus rats fed control diet supplemented with either tolrestat (T) or HAR-1 at 100 mg/kg body wt/day (H). B: Control diet (C) versus rats fed 40% galactose diet (G) or supplemented with either tolrestat (GT) or HAR-1 (GH). C: Graph summarizing results of PKCg content in lens from control, galactose, tolrestat alone, HAR-1 alone, tolrestat/galactose, and HAR-1/galactose fed rats. These are scans of western blots of the PKCg band. For A-C, western blots were visualized with anti-PKCg antisera (Transduction Labs, 1:1000) and secondary IgG with Pierce supersignal. In C, results are presented as the mean of four separate runs (four rat lenses in each run), including the standard error of the mean.