![]() Figure 6 of
Liu, Mol Vis 2001;
7:145-153.
Figure 6 of
Liu, Mol Vis 2001;
7:145-153.
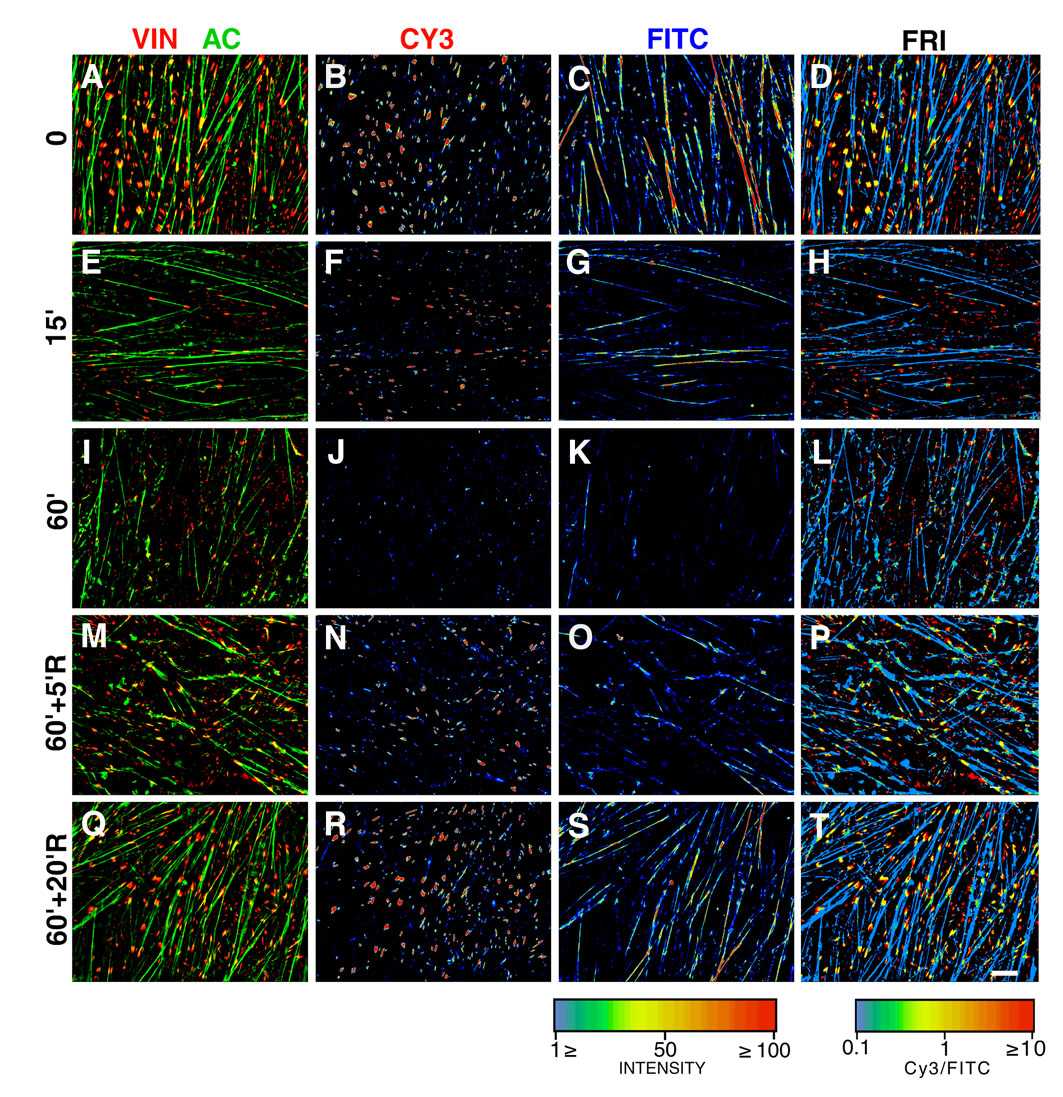
Figure 6. FRI of vinculin and actin in HTM cells treated with H-7
A-L: Digital microscopic analysis of HTM cells, double-labeled for vinculin (VIN; CY3) and actin (AC; FITC), before (0) and after 15 or 60 min (15'; 60') of treatment with 300 mM H-7. M-T: Cells treated with H-7 for 1 h and then incubated in medium without H-7 for 5 min or 20 min (60'+5'R; 60'+20'R). The left column shows the superimposed images of vinculin (red) and actin (green). The columns marked CY3 and FITC show the intensity of labeling of the respective proteins, using the spectrum scale presented under the FITC column. The FRI column depicts the CY3-to-FITC intensity ratio (scale shown under the column). Bar = 10 mm.