![]() Figure 4 of
Shaw, Mol Vis 2001;
7:6-13.
Figure 4 of
Shaw, Mol Vis 2001;
7:6-13.
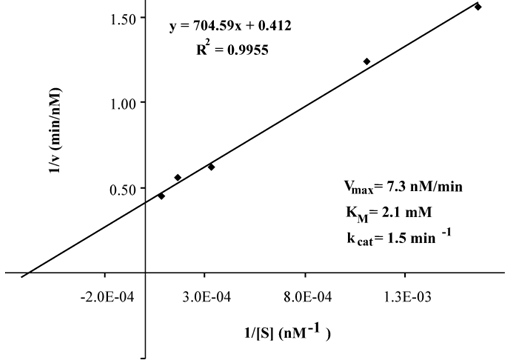
Figure 4. Lineweaver-Burke double reciprocal plot
This graph shows the best-fit straight line through data points generated from a single multiple-turnover kinetic reaction. The kinetic parameters shown are the averages from all multiple-turnover reactions.
