![]() Figure 6 of
Timmers, Mol Vis 2001;
7:131-137.
Figure 6 of
Timmers, Mol Vis 2001;
7:131-137.
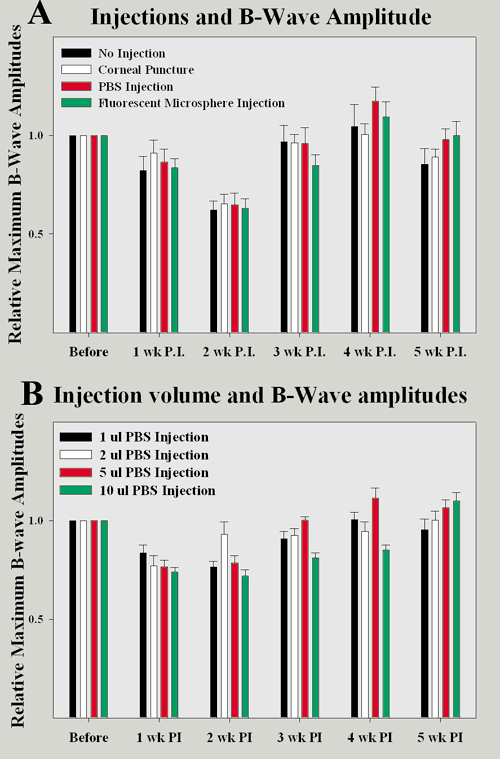
Figure 6. Average relative b-wave amplitudes after subretinal injections of rat eyes
Scotopic full field ERG measurements were done in dark-adapted rats that were flashed with increasing intensities of blue light (-5.1 to -1.84 cd*s*m-2). Measurements were taken pre-injection and weekly for 5 weeks post injection. The b-wave average of all eyes within a group was plotted with standard error bars; PI stands for post-injection.
A: Average relative b-wave amplitudes after subretinal injections into rat eyes. No significant differences were detected between either group over a period of 5 weeks.
B: Average relative b-wave amplitudes after subretinal injection of an increasing volume of PBS-fluorescein mixture in rat eyes. No significant differences were detected between 1, 2, 5, or 10 ml. It appeared that the eyes injected with 10 ml trailed in recovery.
