![]() Figure 2 of
Gendron, Mol Vis 2001;
7:107-113.
Figure 2 of
Gendron, Mol Vis 2001;
7:107-113.
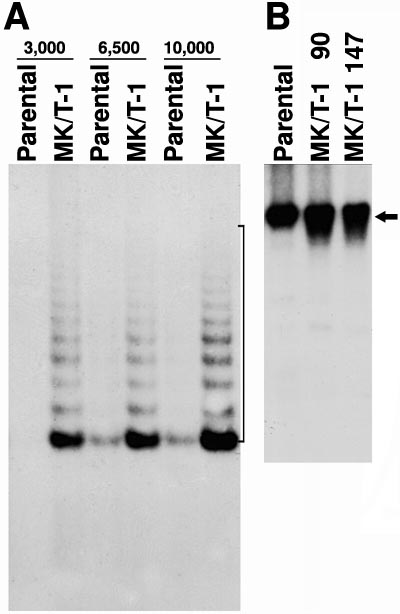
Figure 2. Telomerase analysis in MK/T-1 cells
A: Expression of telomerase activity in the MK/T-1 cells. TRAP assay of MK/T-1 cells (MK/T-1), showing the expression of telomerase activity appearing as the telomere elongation ladder pattern (indicated by bracket at right) compared to parental (Parental) untransfected corneal stroma derived cells at the same cell equivalents which exhibit only low baseline levels of telomerase activity. The cell equivalents used in each parallel TRAP assay reaction are indicated at the top. B: Assessment of relative telomere length (RTL) in parental versus MK/T-1 cells. Southern analysis was performed on Sau3a I digests of genomic DNA using a radiolabeled telomere repeat-specific oligonucleotide probe. The MK/T-1 cells at passages 90 and 147 (MK/T-1 passage 90 and 147) showed no difference in the electrophoretic mobility of the 23 kDa band hybridizing to the telomere repeat-specific oligonucleotide probe and representing RTL (arrowed) when compared to parental cell cultures shown in the first lane.