![]() Figure 1 of
Gendron, Mol Vis 2001;
7:107-113.
Figure 1 of
Gendron, Mol Vis 2001;
7:107-113.
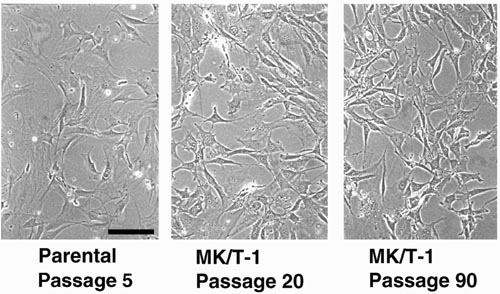
Figure 1. MK/T-1 cell morphology
Shown are phase contrast views of early (20 passage) and late (90 passage) MK/T-1 cells growing in a tissue culture dish compared to the parental untransfected cells derived from corneal stroma cultures at passage 5. MK/T-1 cells appear fibroblastic. Scale bar represents 50 mm.