![]() Figure 3 of
Hartman, Mol Vis 2001;
7:95-100.
Figure 3 of
Hartman, Mol Vis 2001;
7:95-100.
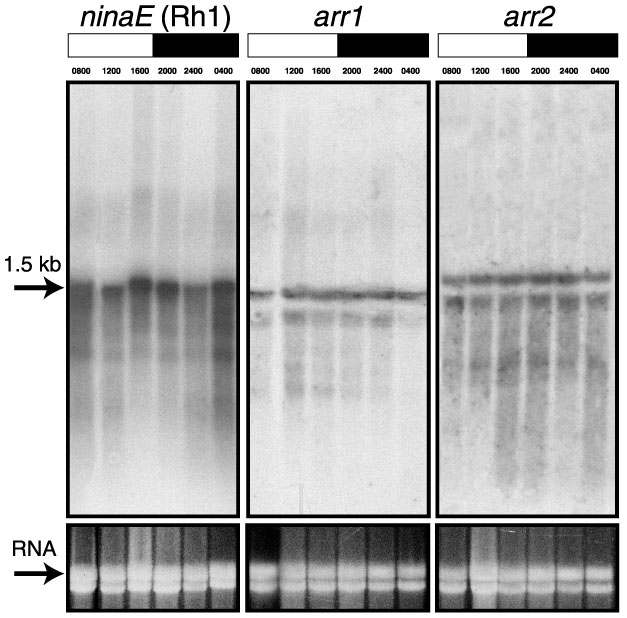
Figure 3. Northern blot analysis
Northern blot analysis reveals expected transcripts of 1.5 kb for ninaE (Rh1) [41,62], 1.45 kb for arr1 and 1.65 kb for arr2 [42,63,64]. The flies were maintained on a 12L/12D cycle. Heads were collected at 4 h intervals: 0800, 1200, 1600, 2000, 2400, and 0400. The lights were on at 0800 and off at 2000. White boxes represent the time of lights on and black boxes represent lights-off. 10 mg of total RNA was loaded per lane and 18S rRNA was used as a loading control. Each band was scanned three times and the peak area was integrated with Sigmagel software. The mean areas were normalized by calculating the ratio of the mean area and the amount of rRNA loaded.
               Normalized areas by time (mean±standard deviations)

Gene        0800          1200         1600         2000         2400         0400
-----   ------------   ----------   ----------   ----------   ----------   ----------
ninaE   14,991±  312   15,327±815   15,392±452   17,561±317   14,988±818   16,282±538
arr1     9,737±1,066   10,617±257    9,897±371   11,622±188   12,221±918   12,815±247
arr2    12,111±  407   11,666±275   13,948±303   15,065±113   15,365±483   13,383± 11
|