![]() Figure 2 of
Hartman, Mol Vis 2001;
7:95-100.
Figure 2 of
Hartman, Mol Vis 2001;
7:95-100.
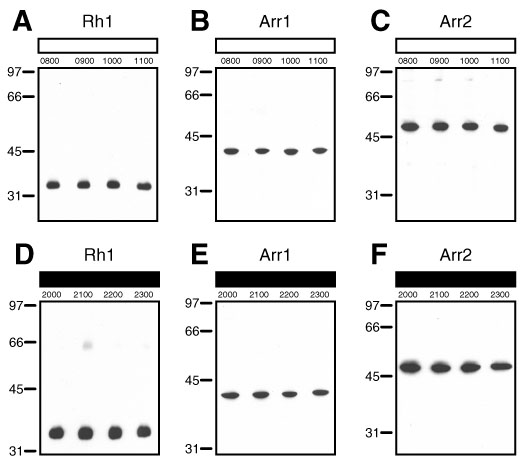
Figure 2. Expression of Rh1 and arrestin at the time of light onset and lights-off
Immunoblot analysis reveals Rh1 and arrestin expression at the time of light onset (A-C) and lights off (D-F). A,D: Rh1 is detected with the 4C5 antibody (34 kD, 2 heads per lane); B,E: Arr1 (37 kD, 20 heads per lane); C,F: Arr2 (48 kD, 20 heads per lane). The flies were maintained on a 12L/12D cycle. Heads were collected at 1 h intervals: 0800, 0900, 1000, and 1100 at the time of light onset, and at 2000, 2100, 2200, and 2300 at the time of lights-off. When band density was normalized to Ponceau S staining of the nitrocellulose, no significant variation was observed between lanes. The lights were on at 0800 and off at 2000. White boxes represent the time of lights on and black boxes represent lights off.
