![]() Figure 1 of
Hartman, Mol Vis 2001;
7:95-100.
Figure 1 of
Hartman, Mol Vis 2001;
7:95-100.
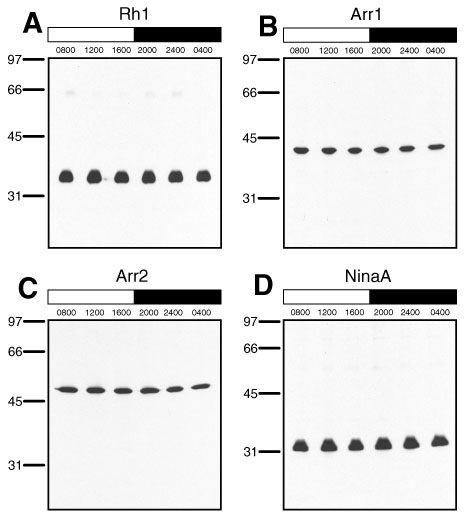
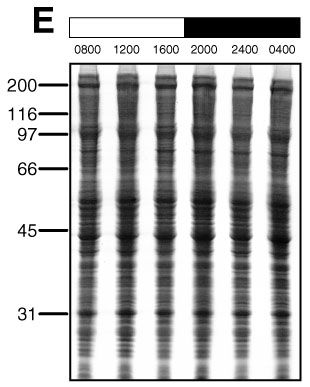
Figure 1. Expression of Rh1, arrestin, and NinaA over the 12L/12D cycle
Immunoblot analysis reveals protein expression over the 12L/12D cycle. A: Rh1 is detected with the 4C5 antibody (34 kD, 2 heads per lane); B: Arr1 (37 kD, 20 heads per lane); C: Arr2 (48 kD, 20 heads per lane); D: NinaA (32 kD, 20 heads per lane); E: Coomassie Blue staining reveals no detectable differences in total protein over the 12L/12D cycle (10 heads per lane). The flies were maintained on a 12L/12D cycle. Heads were collected at 4 h intervals: 0800, 1200, 1600, 2000, 2400, and 0400. Each band was scanned three times and the peak area was integrated with Sigmagel software. The lights were on at 0800 and off at 2000. White boxes represent the time of lights on and black boxes represent lights off.
               Protein expression by time (mean±standard deviations)

Protein     0800       1200       1600       2000       2400       0400
-------   --------   --------   --------   --------   --------   --------
Rh1       6446±177   6814±464   6527±310   6701±374   6448±204   6074±144
Arr1      4212±212   4477± 26   4160± 82   4365±174   4107±412   3862±262
Arr2      5042±409   5017±150   4790±343   4880± 96   4215±134   3335±117
NinaA     6122±332   7527±200   6883±337   7076± 32   6651±220   5931±199
|