![]() Figure 4 of
Lyubarsky, Mol Vis 2001;
7:71-78.
Figure 4 of
Lyubarsky, Mol Vis 2001;
7:71-78.
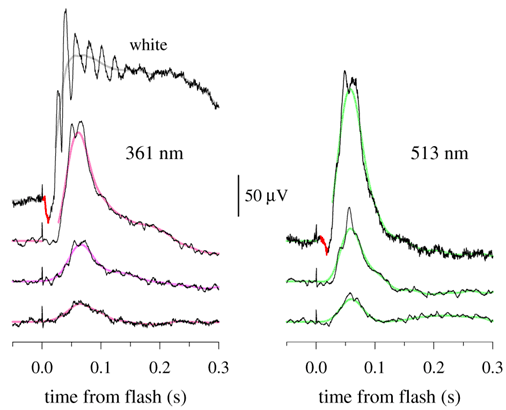
Figure 4. Cone-driven ERGs of an a RGS9-1 -/- mouse to 361 and 513 nm flashes of stepped intensity
Each trace is the average of from 3 to 5 individual responses. The intensities of the 361 nm flashes were (from lowest to highest intensity) 620, 1050, and 6020 photons mm-2 at the cornea. The 513 nm intensities were 2500, 5000, and 25600 photons mm-2 at the cornea. The topmost trace in the "361 nm" column is the response to a white flash estimated to 1.2% of the M-cone pigment and 0.09% of the UV-pigment. The smooth gray traces were obtained by convolving the measured traces with a Gaussian function having a standard deviation of 10 ms (bandwidth at 3 dB, 13.25 Hz); the peak amplitudes extracted from the filtered traces are (in mV) 22, 45, 134 (361 nm), 28, 65, 187 (513 nm) and 180 (white). The a-wave component of the responses to the two strongest flashes has been highlighted in red.
