![]() Figure 6 of
Honda, Mol Vis 2001;
7:63-70.
Figure 6 of
Honda, Mol Vis 2001;
7:63-70.
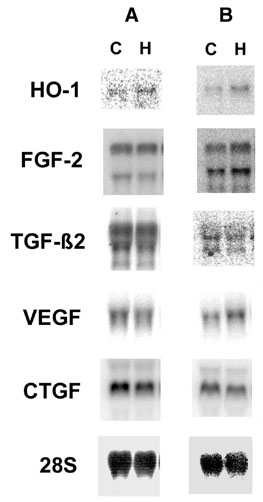
Figure 6. The effect of hyperoxia on gene expression
The change in gene expression by RPE340 (A) and WI38 cells (B) grown in hyperoxia. RPE340 cells and WI38 cells were grown in 20% O2 (C; control) and 40% O2 (H; hyperoxia) for 24 h, followed by RNA extraction and northern blot analysis. Signals were normalized to 28S rRNA.