![]() Figure 4 of
Honda, Mol Vis 2001;
7:63-70.
Figure 4 of
Honda, Mol Vis 2001;
7:63-70.
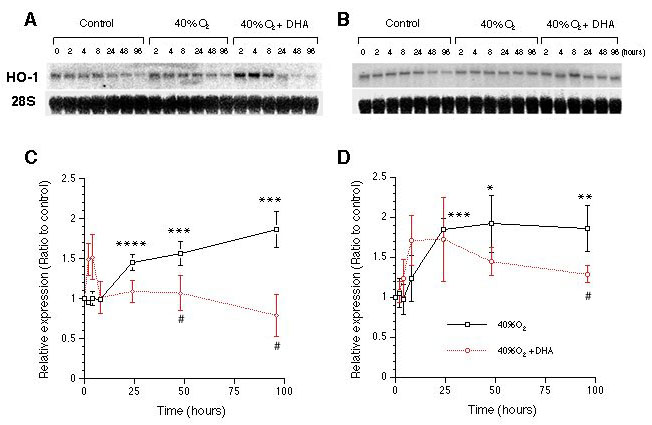
Figure 4. Northern analysis of HO-1 expression
Northern analysis of HO-1 mRNA expression by RPE340 cells (A) and WI38 cells (B). Cells were cultured in 20% O2 (Control), 40% O2, and 40% O2 with DHA (150mM). Signals of HO-1 were normalized against that of 28S rRNA. The ratio of hyperoxia treated: controls at each time point was determined for RPE340 cells (C) and WI38 cells (D) from three independent experiments. Values are shown as mean±SE. Data of each condition were compared at the same time point. Significance levels for comparison to controls: *p<0.05, **p<0.01, ***p<0.005, ****p<0.001. Significance levels for comparison to hyperoxia treated cells without DHA: #p<0.05.